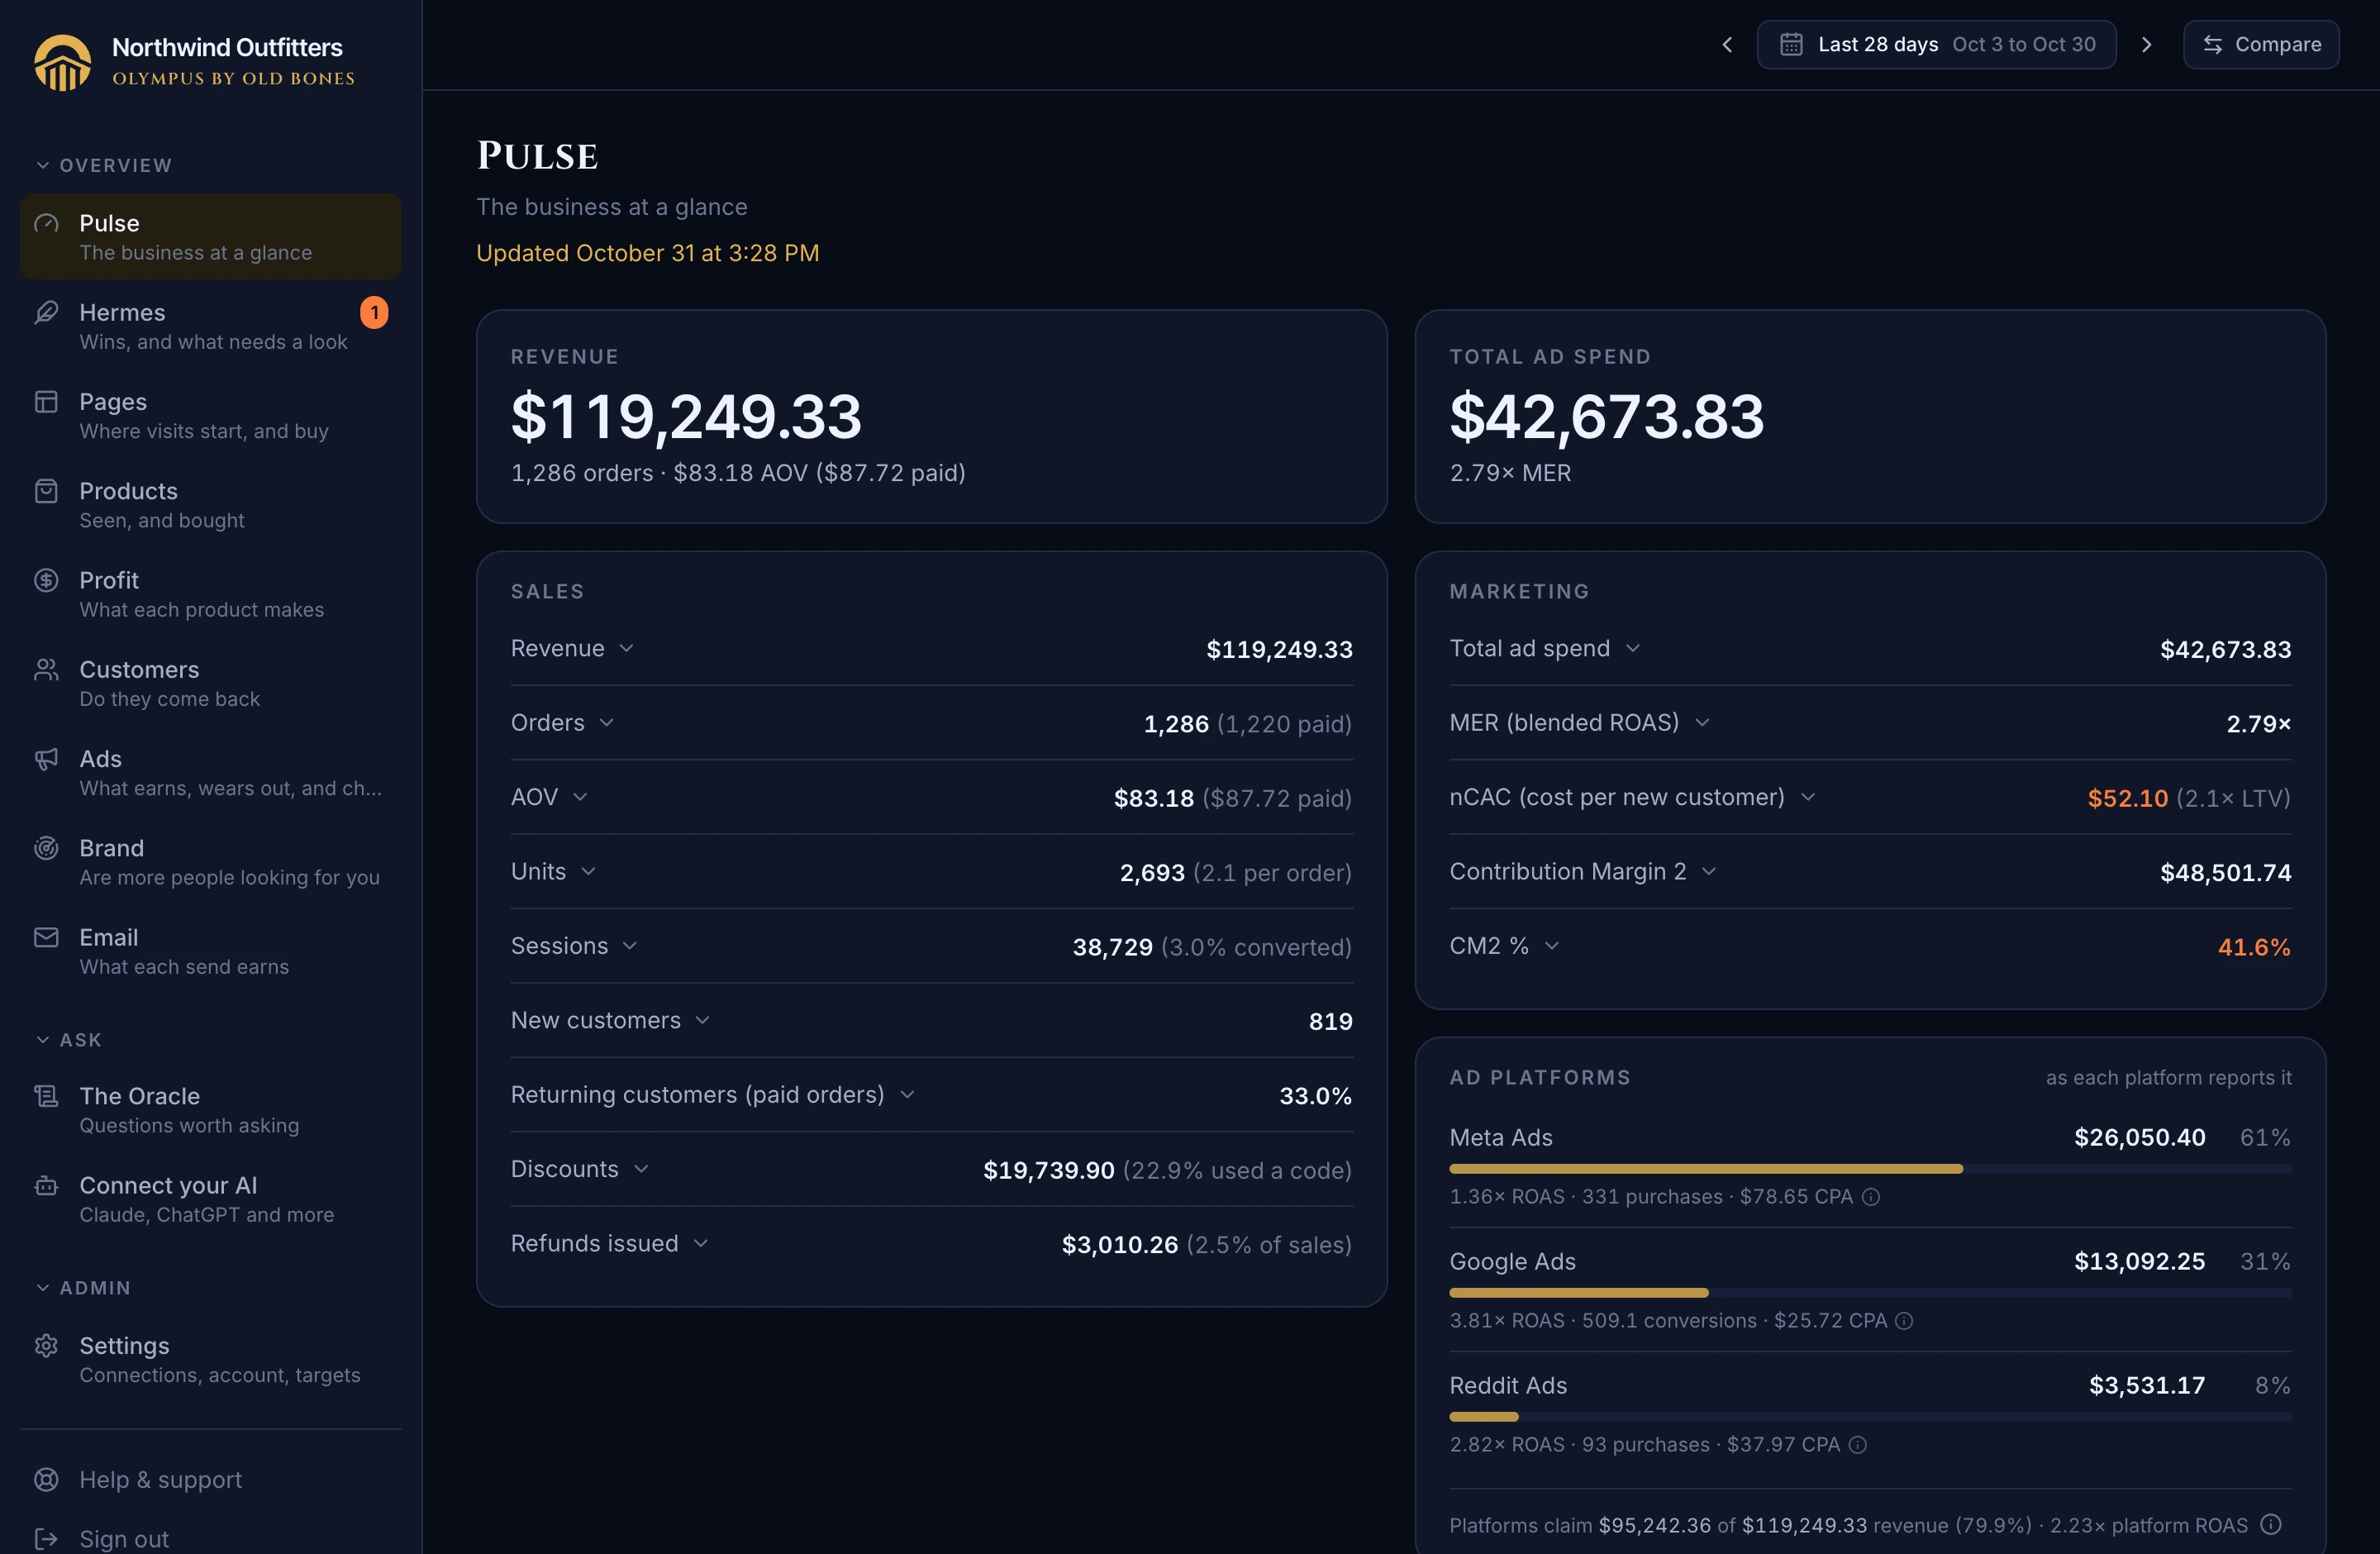
Sales, orders, ads and what you keep after them, on one screen that matches Shopify to the cent. Free is everything you connect and see; Pantheon adds asking about it in your own AI.
Free
Pulse puts revenue, orders, average order value, customers, ad spend and what you keep after ads on one page, for today or any period, exact to the cent. The numbers match Shopify Analytics, so there's nothing to reconcile.
Sound familiar? Checking Shopify, Meta, Google and a spreadsheet every morning to answer "how are we doing?"
Where: Pulse
Free
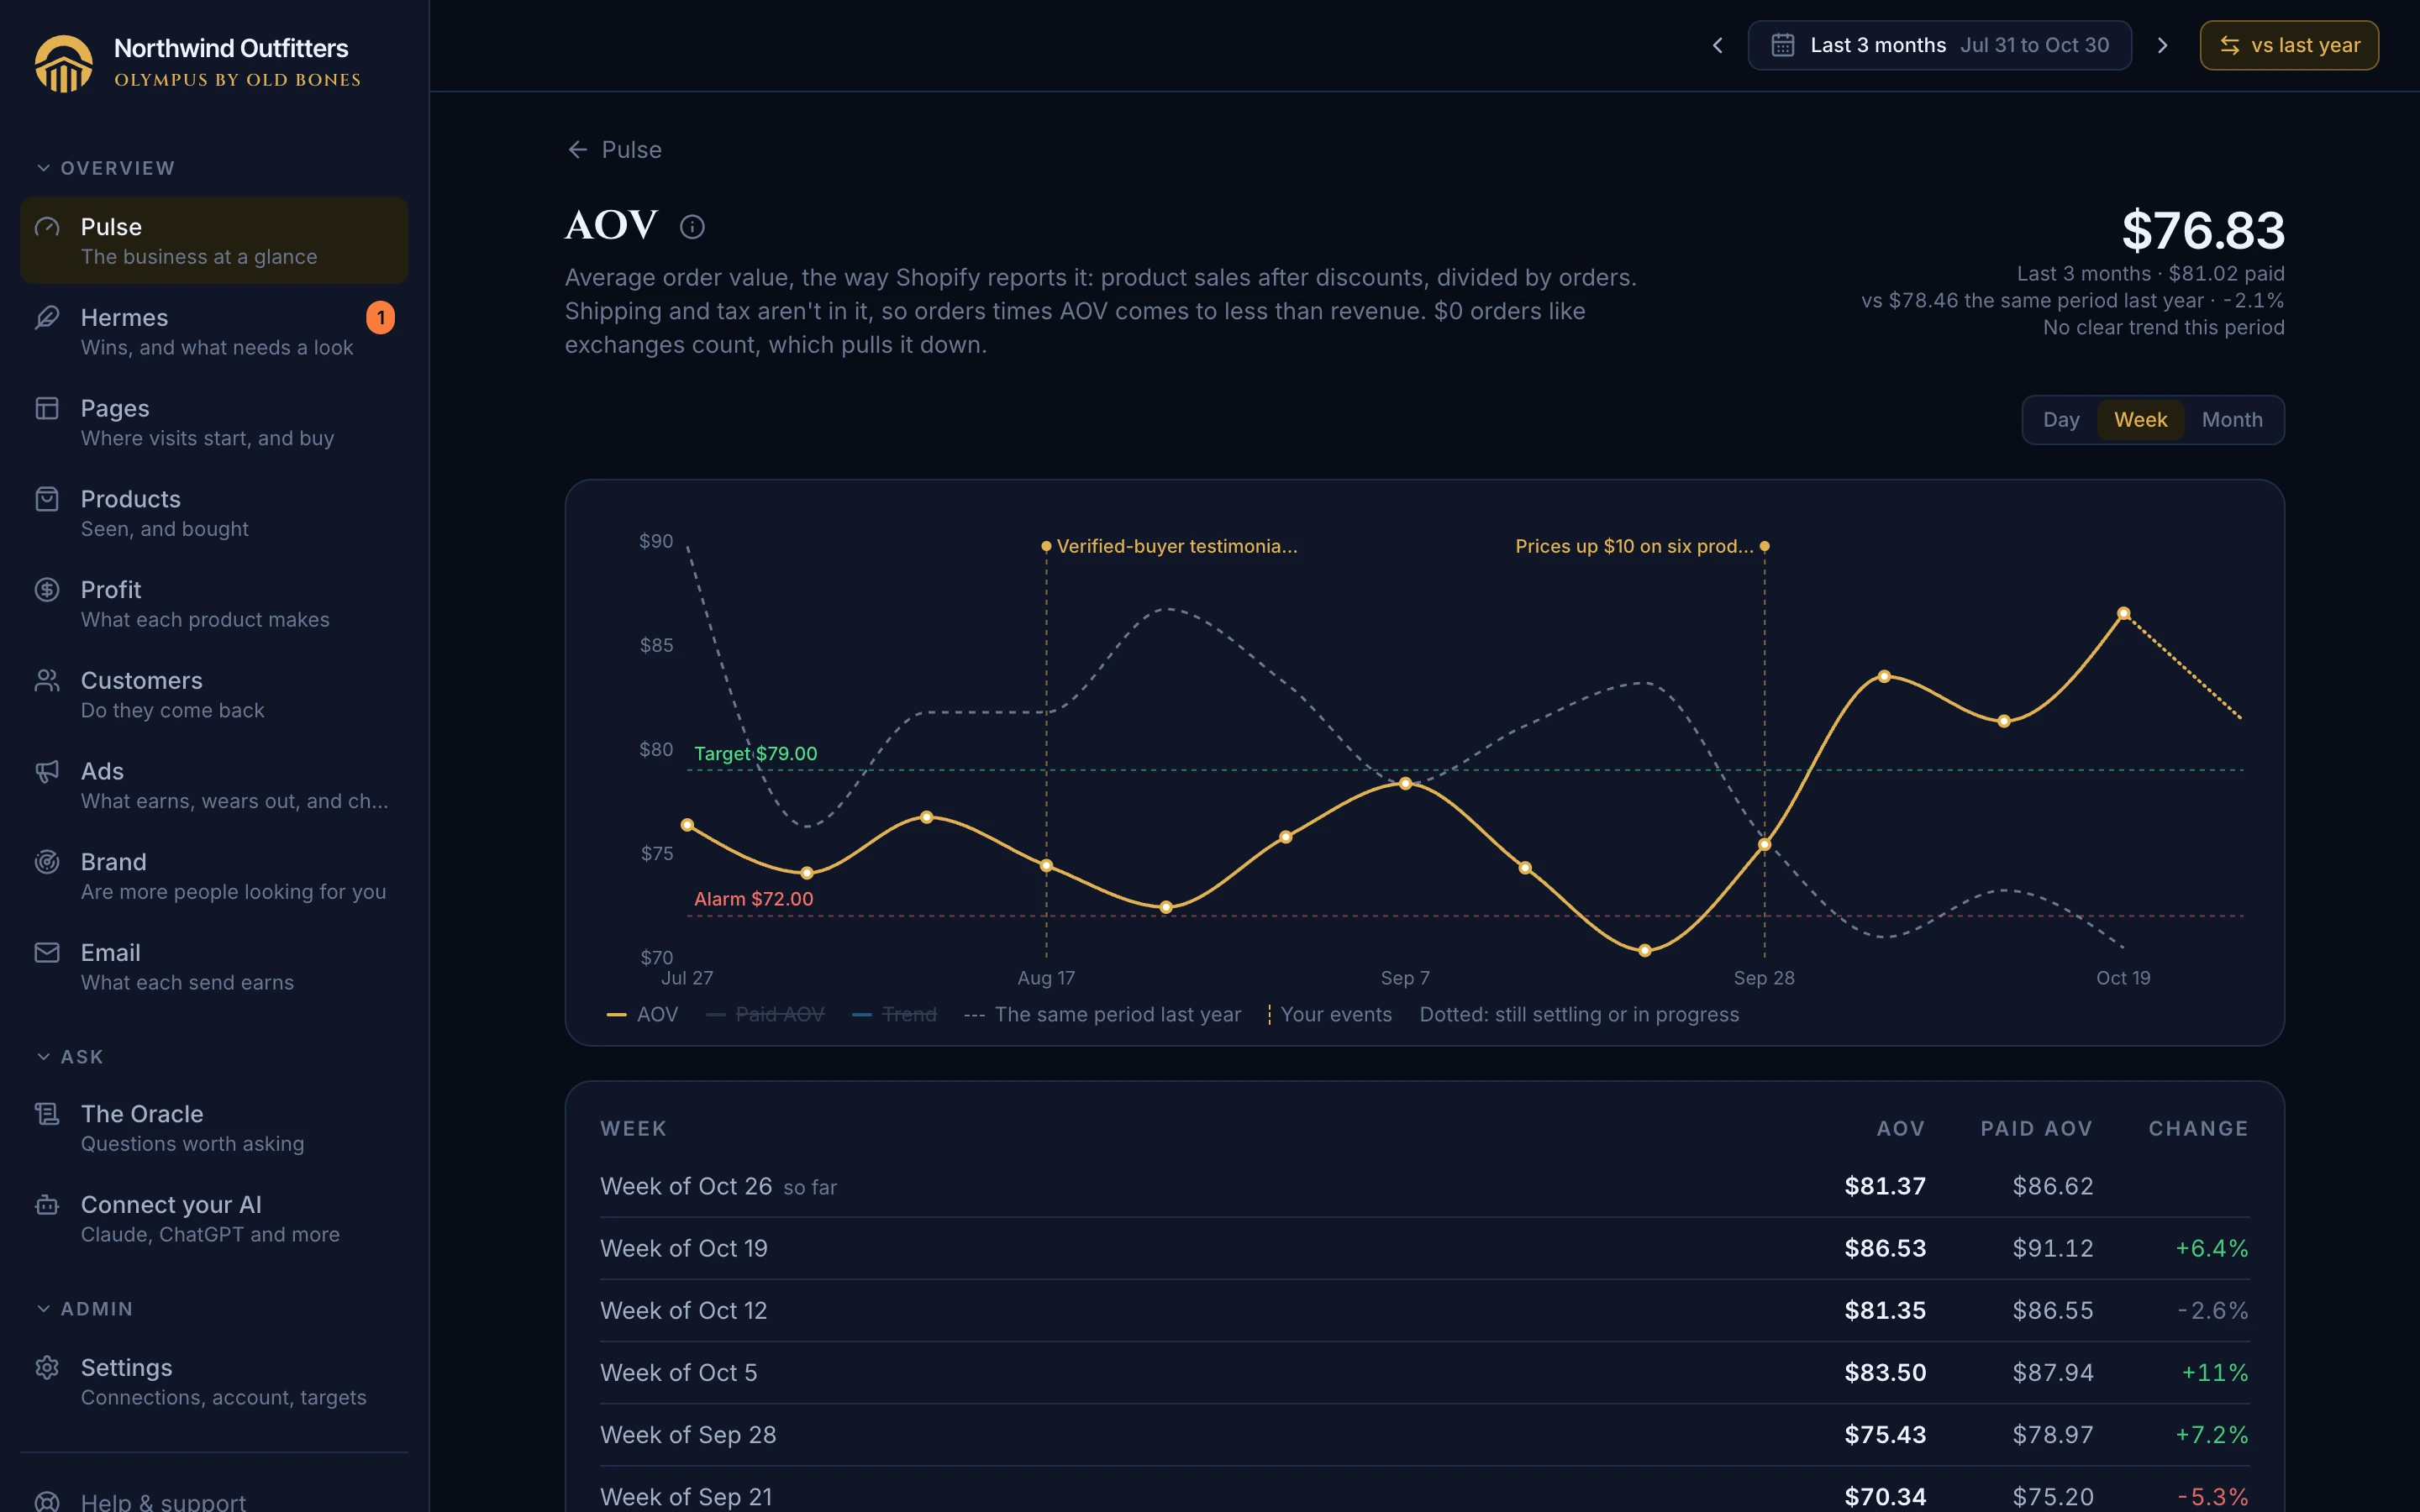
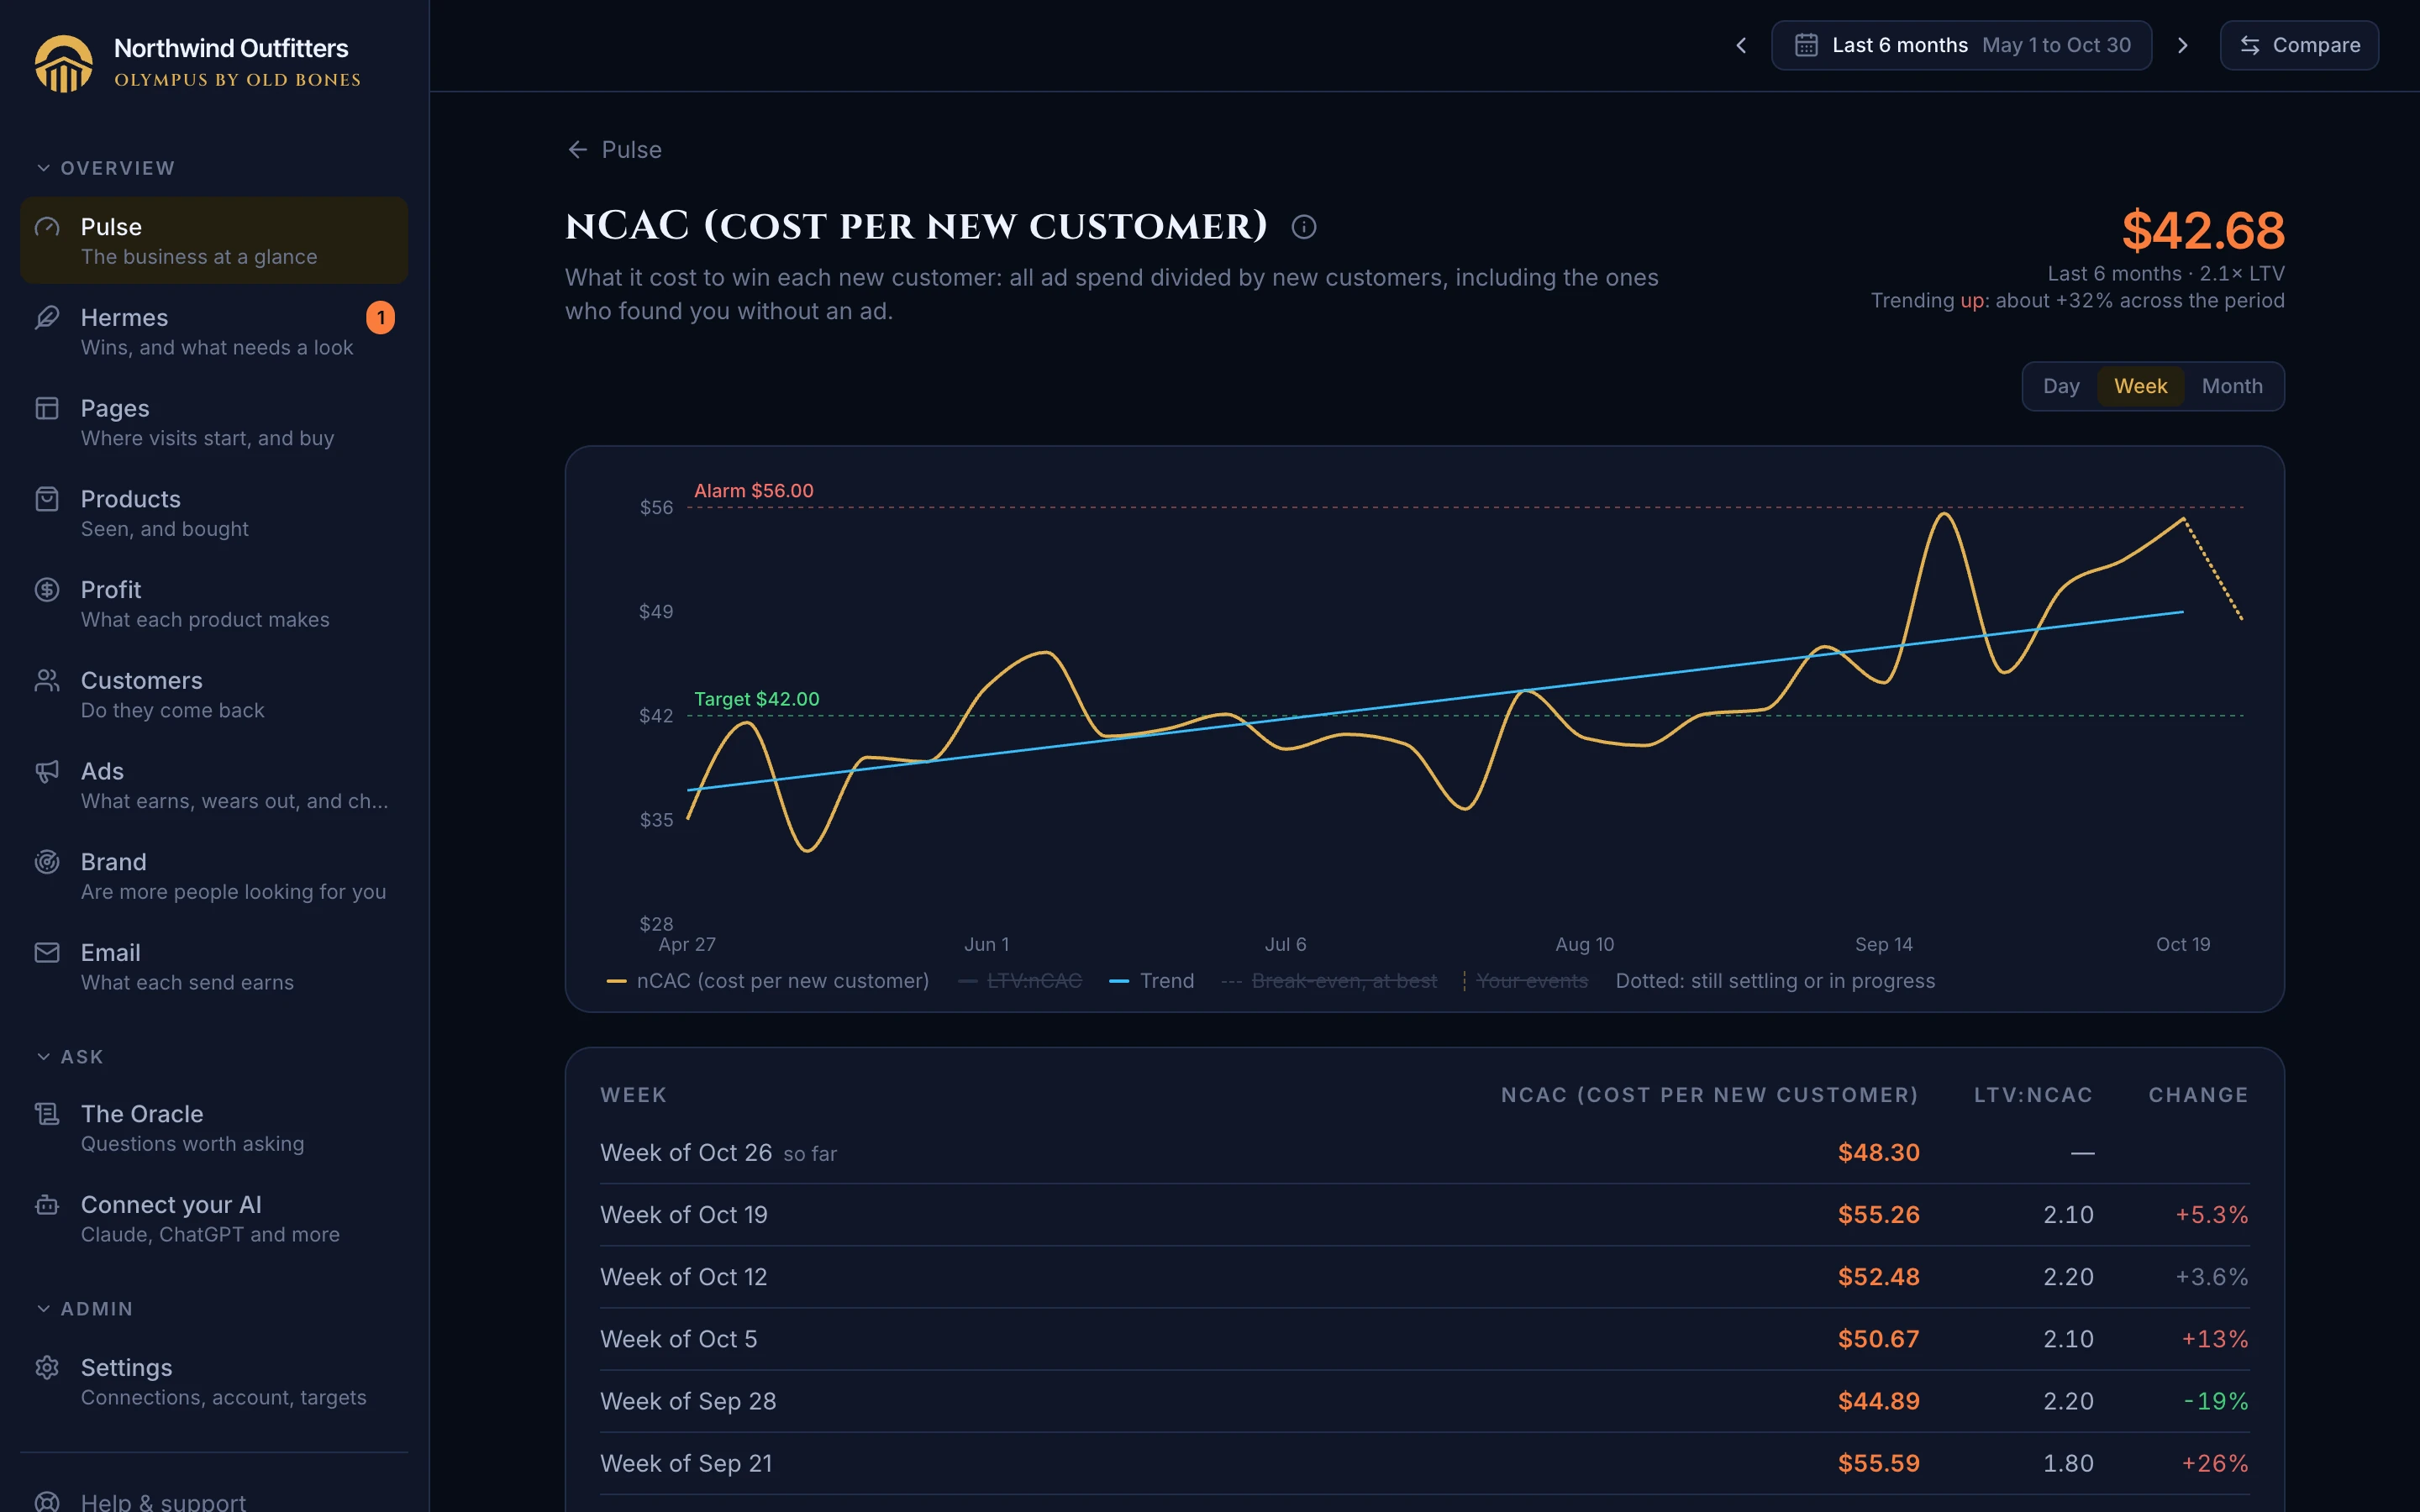
Click any number for its history over the same period you were looking at, by day, week or month, with the right chart for it, a table of every period and its change, and a plain-words explanation of what it means, where it comes from and when it's final. Compare it with the period before or last year, drawn behind it, and see its trend in one line: trending up, trending down, or no clear trend, with one bad day never mistaken for a turn. The trend counts the last few days even while ad platforms are still crediting them, corrected for the purchases your store's own history says are still to come, so a rise shows up this week, not next. A number built from others says how in words, each piece one click from its own page, and your margins show where the money went: sales, the sales tax that was never yours, product costs, shipping, fees and ads, line by line down to what you kept.
Sound familiar? A number on a dashboard with no history, no definition and no way to tell if it's normal, or which way it's heading.
Where: Pulse, click any value
Free
See how today is building, in 15-minute steps, next to where yesterday stood at this exact time. "Down 20% at 10 AM" stops being a scare when yesterday looked the same at 10 AM.
Sound familiar? Comparing a half-finished today with a whole yesterday, and panicking every morning.
Where: Pulse, any single day; the Compare button
Free
Pulse opens on the last numbers you saw, straight away, and says it's fetching the latest while it does. A moment later the fresh numbers are in, with the time they're from. Signing out clears what was kept.
Sound familiar? Staring at a blank screen in a parking lot, waiting to see how today is going.
Where: Pulse, on the phone's home screen or in a browser
Free
Exchanges, replacements and free orders show up in Shopify as $0 orders and drag your average order value down. Paid AOV leaves them out, so a busy week of exchanges doesn't look like customers spending less.
Sound familiar? An average order value that drops every time the warehouse processes exchanges.
Where: Pulse, Orders and AOV; their metric pages
Free
Refunds are counted the day you issue them, the day the money goes back out. Over a week or more you also see the share of sales that went back, so a creeping refund rate shows before it hurts.
Sound familiar? Refunds buried in old orders, so you never see the day a pile of returns went back out.
Where: Pulse, Refunds issued; its metric page
Free
Add Olympus to your phone's home screen and it opens like an app, straight to Pulse, with the headline numbers first. Pick a light or dark theme, or follow your device.
Sound familiar? Pinching and scrolling a desktop dashboard on a phone to check one number between meetings.
Where: Your phone's home screen; Settings, Appearance
Free
Olympus suggests a target for each metric from your own last few months: your typical week as the target, your worst week as the alarm. One click sets them, and they're drawn on every chart and colour Pulse when something slips. Each ad platform you connect gets its own section, so Meta and Google can each have their own ceiling on what a new customer costs. A platform's CPA and ROAS targets say which attribution rule they're on: Meta's sit on 7-day click for every ad set, so a target still means the same thing after an ad set starts counting views, and a suggestion drawn from weeks where that happened says so.
Sound familiar? Being told to hit "industry benchmarks" that were set by stores with different prices and margins.
Where: Settings, Targets, with a section for each connected ad platform; the "Set your targets" step on Setup
Free
Conversion rate gets a floor, not a target: when a week drops below the worst you've had, something likely broke, like a checkout bug, an app conflict or a payment method. Pulse turns it red, so a broken checkout shows up as a red number, not a mystery week of lost sales.
Sound familiar? Finding out the checkout was broken days later, from a sales dip nobody could explain.
Where: Settings, Targets; Sessions and Conversion rate on Pulse
Free
When your ad history is shorter than your sales history, Olympus says where the ad data starts and leaves ad-based figures out of any period that reaches before it, instead of counting those months as zero spend. MER, CPA and CM2 over a long period are only shown when every day of it is covered. An ad account you opened after your store isn't a gap: before the day it was created, it spent nothing, and is counted that way.
Sound familiar? Year-over-year numbers that look amazing because the ad spend from most of the year is missing.
Where: Pulse, each metric's page, each ad platform's page
FreeMore on Pantheon
Hermes tells you what changed since you last looked, and only that: a number past the line you set or back inside it, or its best or worst week in three months, each beside what happened that week. Wins are celebrated as loudly as warnings, and a run of records is one item that updates, never the same news every Monday. It judges only weeks whose numbers have settled, so a late-reporting ad platform never raises a false alarm. Between weeks, a day with far more or far fewer orders than that weekday usually brings is marked the morning after, so a broken checkout doesn't wait for the week's news. Mark an item read and it stays on the page, out of your count, until it gets worse. The past year is there too, a week at a time, from the day you connect. On the Pantheon plan, each item asks Hermes why in your own AI.
Sound familiar? Finding out a week later that your checkout broke or an ad budget ran away, missing a record week worth repeating, or a daily report that says the same thing until you stop reading it.
Where: Hermes
FreeMore on Pantheon
Settings, Timeline keeps the dated events behind your numbers: a price change, a sale, a new theme, a supplier delay, a test you're running. Log one in seconds, with the products it touches and how long it ran. On the Pantheon plan your agents read the last few months of it in every answer, so when conversion dips the week a price went up, they say so. Olympus finds the rest itself every night: each price change (from what every variant sold at, leaving out subscription prices and one-day blips), each launch, and each product that sold out or came back, on that product's charts in a quieter grey. Each event marks Pulse's, a platform's and its product's charts, a dashed line where it happened and a band while it ran, named when you hover; a click on "Your events" in any chart's legend hides them on every chart. Your ad accounts' own change history sits beside it.
Sound familiar? A number moves and the reason lives in someone's head, so every AI answer guesses at it or blames the ads.
Where: Settings, Timeline; marked on the charts
Free
Olympus copies every product and collection page each night and notes what changed: a title, an SEO title or description, the web address, the description, the status, a collection's products or rules. One entry per page per day, with the old and new title, so when a page slips in Google you can see what was changed on it, and when, before blaming Google. The big ones (a title, SEO title, web address or status) mark your charts; smaller ones stay on that product's chart and in the list behind "Show page edits", with a "What changed" filter. Your AI can ask for them too. Edits to markup or spacing alone, prices and stock don't count.
Sound familiar? A page drops in search and nobody remembers what was changed on it, or when, so the answer is a guess.
Where: Settings, Timeline (Show page edits); marked on the charts